
Mayavi Project
3D Scientific Data Visualization and Plotting
The Mayavi project includes two related <em>packages</em> for 3-dimensional visualization:
- Mayavi : A tool for easy and interactive visualization of data, with seamless integration with Python scientific libraries.
- TVTK: A Traits-based wrapper for the Visualization Toolkit, a popular open-source visualization library.
These libraries operate at different levels of abstraction. TVTK manipulates visualization objects, while Mayavi lets you operate on your data, and then see the results. Most users either use the Mayavi user interface or program to its scripting interface; you probably don't need to interact with TVTK unless you want to create a new Mayavi module.
Mayavi
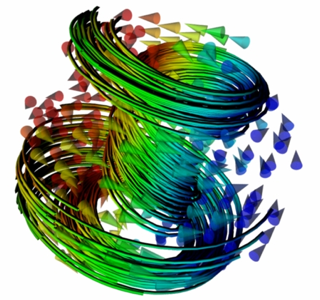
Mayavi seeks to provide easy and interactive visualization of 3-D data. It offers:
- An (optional) rich user interface with dialogs to interact with all data and objects in the visualization.
- A simple and clean scripting interface in Python, including one-liners, or an object-oriented programming interface. Mayavi integrates seamlessly with numpy and scipy for 3D plotting and can even be used in IPython interactively, similarly to Matplotlib.
- The power of the VTK toolkit, harnessed through these interfaces, without forcing you to learn it.
Additionally Mayavi is a reusable tool that can be embedded in your applications in different ways or combined with the Envisage application-building framework to assemble domain-specific tools.
TVTK
TVTK wraps VTK objects to provide a convenient, Pythonic API, while supporting Traits attributes and NumPy/SciPy arrays. TVTK is implemented mostly in pure Python, except for a small extension module. Developers typically use TVTK to write Mayavi modules, and then use Mayavi to interact with visualizations or create applications.
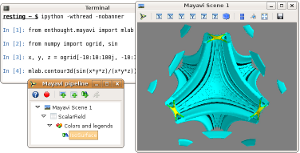
Using Mayavi from ipython.
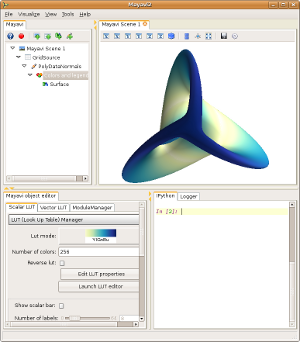
The Mayavi application.
Last updated: Tue 21 November 2017